Top 15 Best Data Visualization Tools (2022): Compared & Reviewed
Introduction
The proliferation in the usage of computational methods across various fields ensures us that more and more data is generated on a daily basis. As we all know, In the world of the internet, data is the modern currency.
However, in order to deploy data as capital, you need to represent it in such a way that it generates coherent insights. No matter what business, organization or institution you are a part of, data analysis is required in order to make sense of it.
Data visualization is an aspect of data analysis which focuses on its visual representation. All data tell a story and data visualization makes this storytelling process more scientific as well as elegant.
It converts discrete data units into an easily comprehensible visual picture. Visual representation of data makes it more amenable to analysis. You can discern patterns and trends more easily from a visual representation.
The internet culture is a visual culture and our perception is becoming more attuned to patterns. Therefore, a shift towards visual representation of data is inevitable. Data visualization tools are methods which make such representations possible.
Given the huge amounts of information being generated across the board, data visualization tools have become necessary for all of us.
In this article, I will offer a comprehensive and a comparative analysis based on intense product research.
Given the variety of data visualization tools available in the market, choosing the right fit for your particular needs becomes imperative. Make sure that you invest your money in a product that is tailor made to suit your purpose.
The comparative analysis provided in the article will help you evaluate specific features of each product so that you can make an informed decision.
1. Databox
This tool is the first on our list because it fulfills all the important checklists in terms of features, ease of use, flexibility, and prices.
It is currently one of the best tools available in the market to envision, represent, visualize and process data.
It is a tool with a well-known brand value in the market. More than 15,000 businesses attest to its efficacy in data visualization.
They have invested in this tool and continue to work with it, which sets a good precedent for your brand.
By taking the examples of these businesses as case studies, you can make the crucial decision of investing in this software.
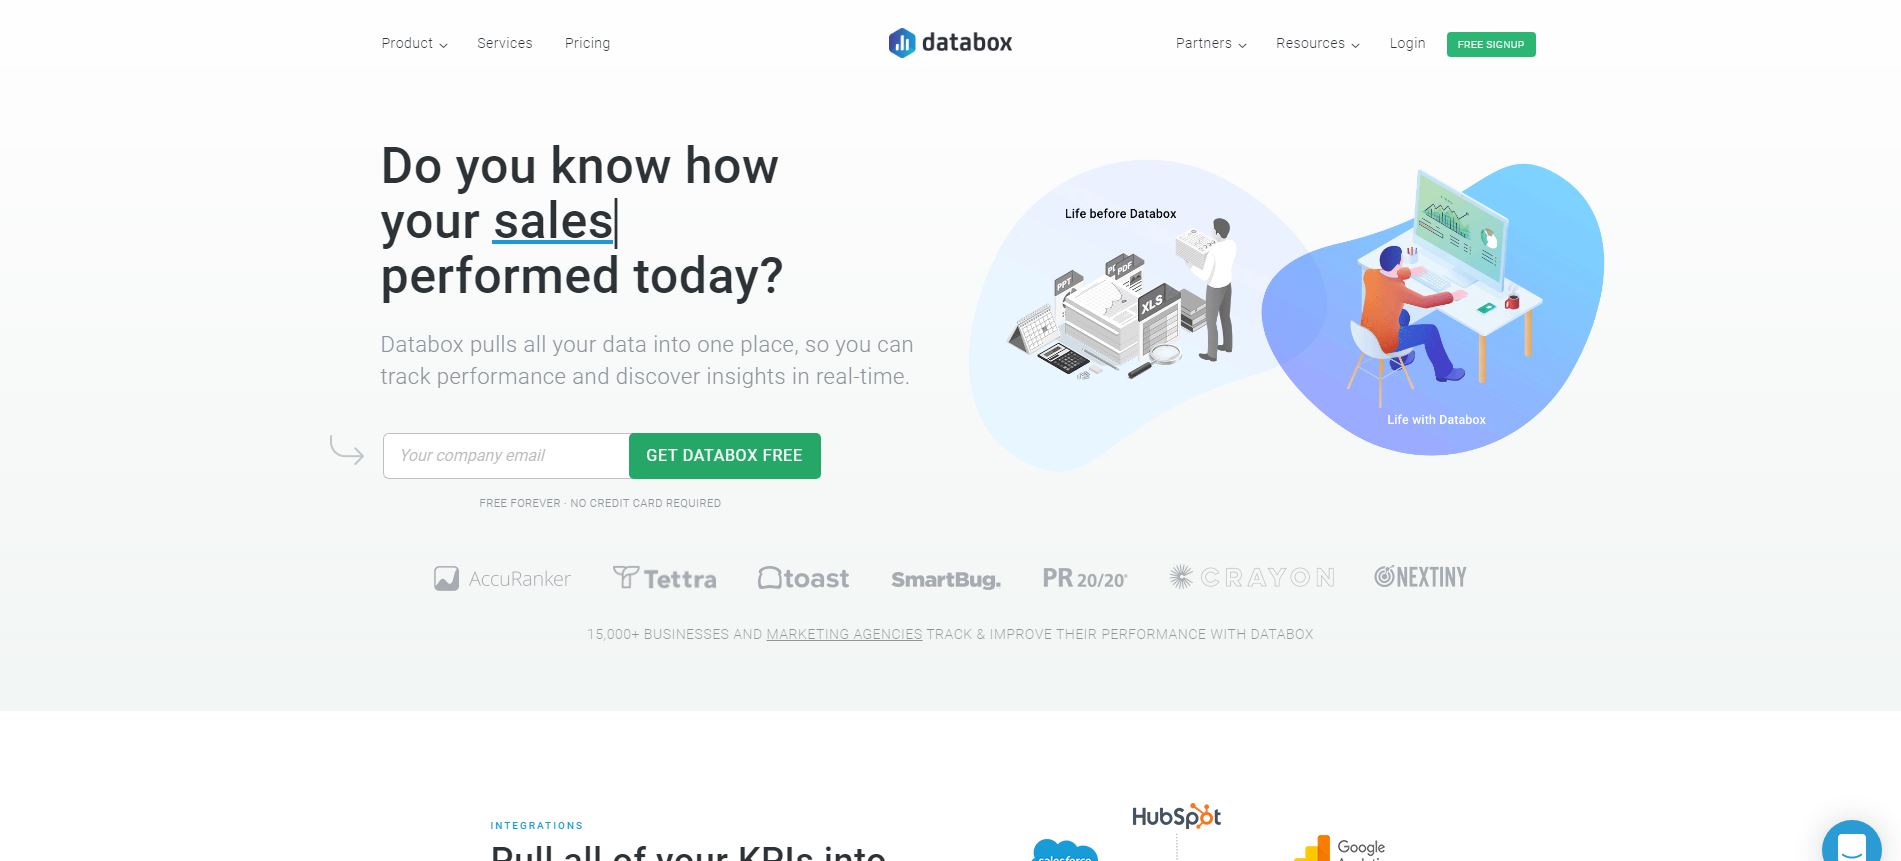
One of the most important and distinctive characteristics of this data visualization tool is that one can conduct business analysis, process information and insights in real time.
This tool will compile your data in a particular location so as to make its processing simpler. It allows the users to keep check on the performance and simultaneously generate results.
Pros
Cons
Pricing:
The best thing about Databox is that it comes with an indefinite free trial plan which allows 3 different databases.
This enables you to test out its working on a small scale before fully committing to the software. Databox offers a range of plans at different price points which you can avail according to your budget.
Their Basic plan costs around $49 a month and the Advanced plan costs $248. Both the plans provide value for money with the ability to refresh databases hourly and providing a platform for multiple users and databases at once.
2. Infogram
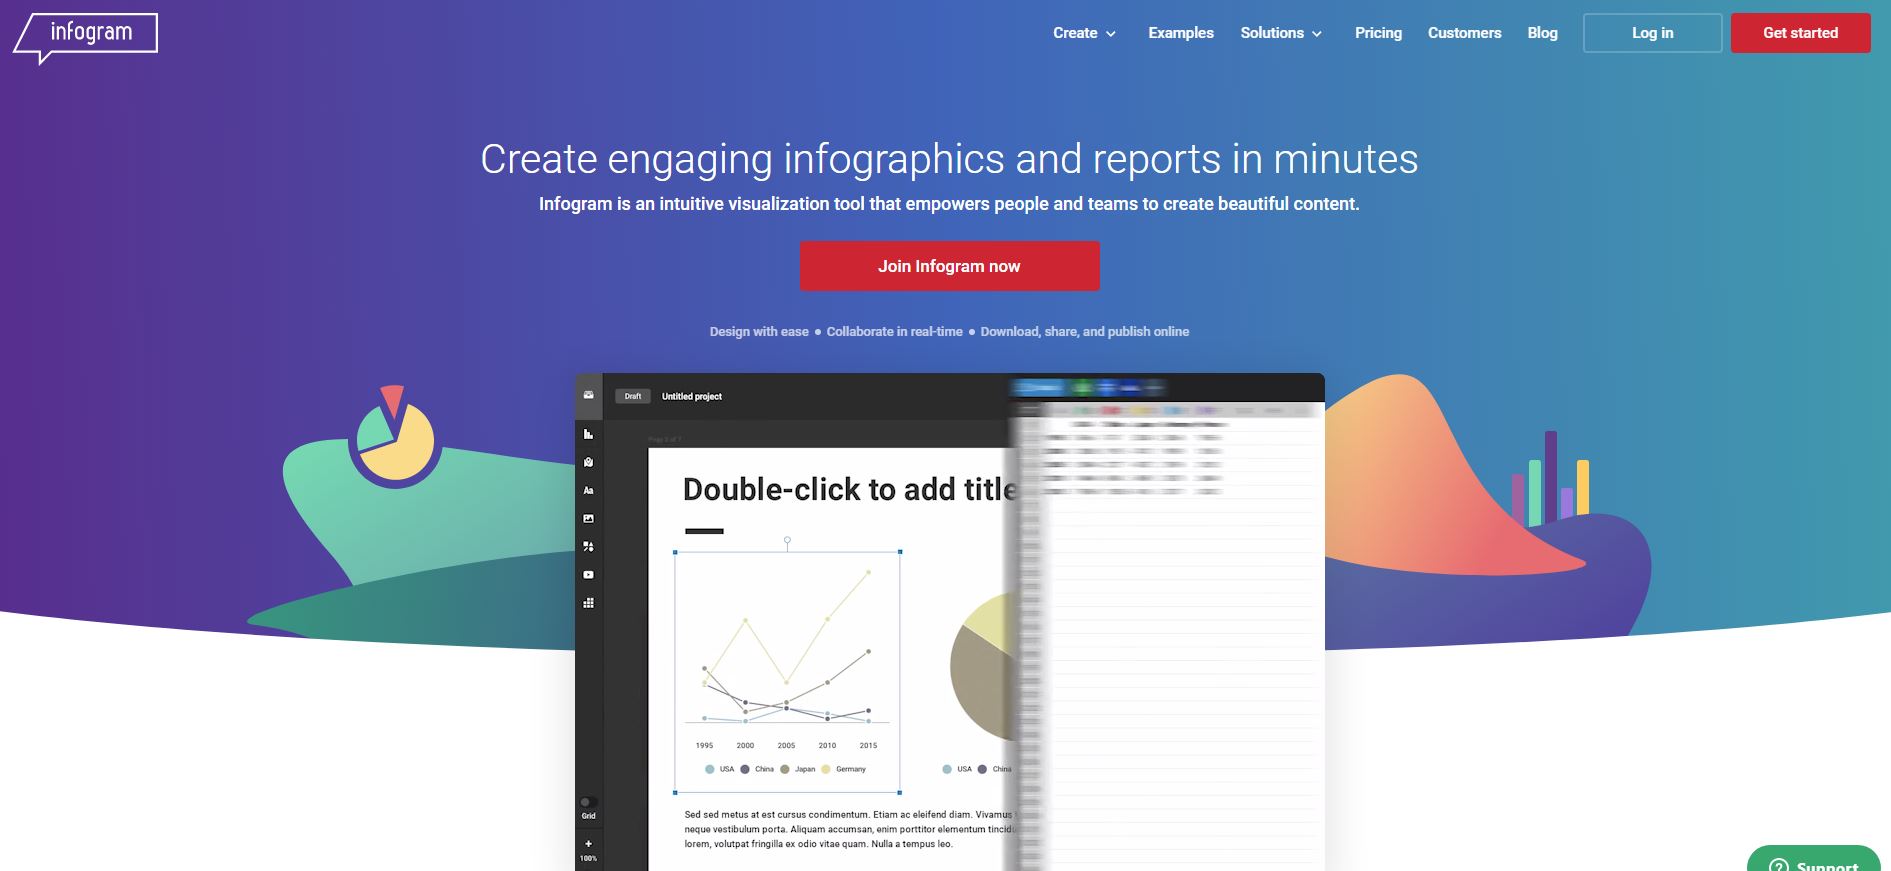
Infogram, with its distinctive feature of generating attractive infographics and providing elegant solutions on a web-based platform, is a software which can not only be used by corporations and businesses but also by educational and academic institutions.
The graphics that are generated using this software are quite persuasive in nature and are used for creating various presentations and reports.
It makes the process of data analysis simpler as well as more efficient.
If you are someone without any prior knowledge of coding or other tech-based skills then this software is perfect for you.

Pros
Cons
Pricing:
There are many unpaid basic options. The paid plans are numerous with price points ranging from $19 per month to $149 per month. It is one of the cheapest options available in the market.
The rationale behind this software is to make data envisioning accessible to all and that is exactly what it does. It is a boon for students and start-ups and small businesses who are trying to grow their business.
3. Tableau
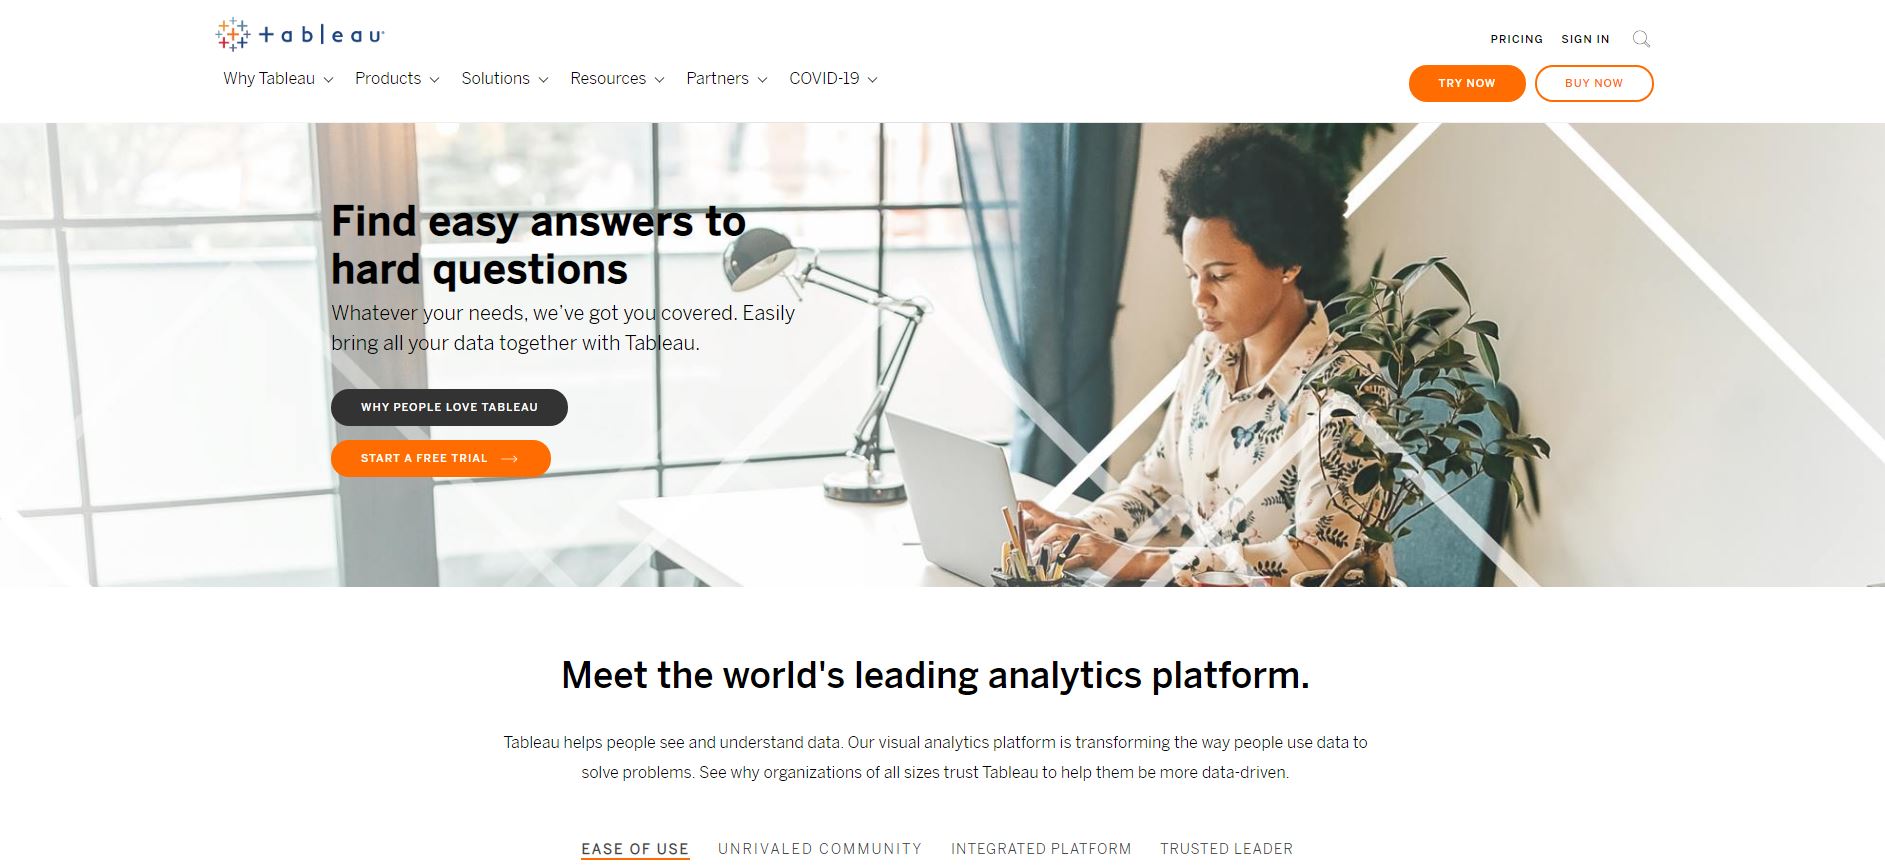
This data visualization tool possesses distinctive characteristic features including ease of usage and automation making it one of the finest data visualization tools in the business.
For organizations which are understaffed in terms of data analysts and tech workers or if the existing tech workers are already burdened with additional tasks, Tableau would be the ideal choice because it does not require an elaborate manual setup.
It comes in the form of a mobile as well as a computer application which further attests to the versatility of the software.
It can be used anytime, anywhere, without hassle. The wide range of visualization options allow for a coherent presentation of data.

Pros
Cons
Pricing:
The price points are comparatively lower. The basic plan costs $12 per user per month and the advanced plan costs $70 per user per month.
A pocket friendly software, it is best for tech startups and small-scale businesses where the employees are familiar with SQL and are tech savvy.
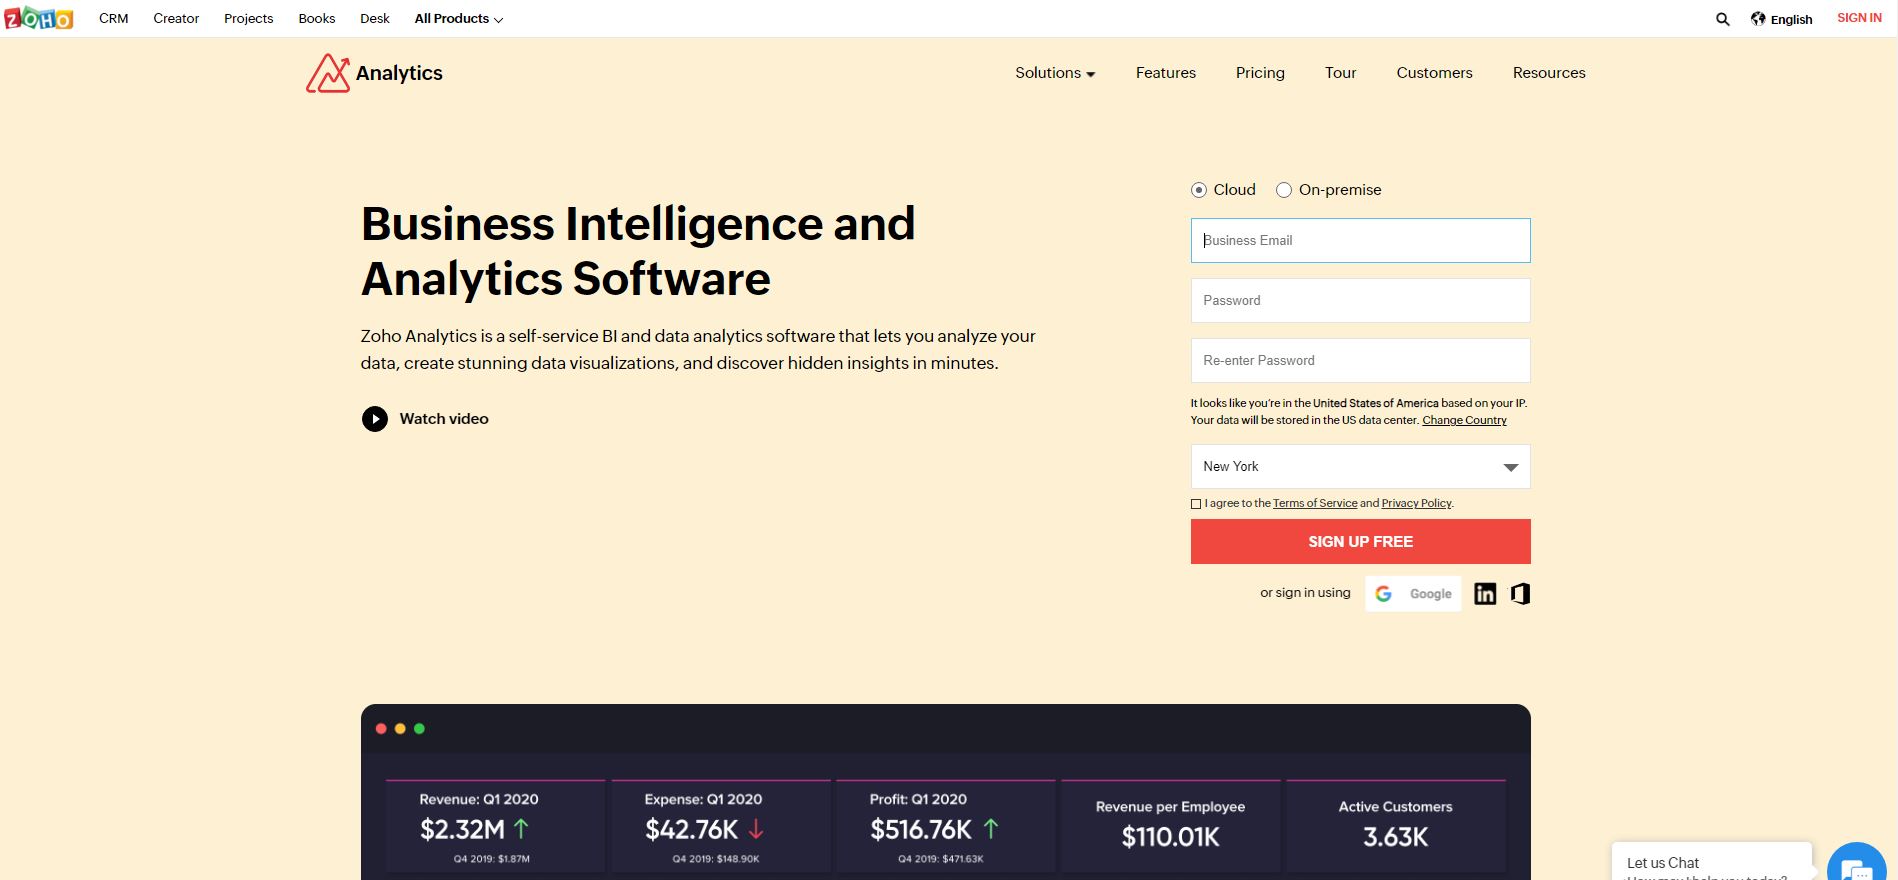
Zoho Analytics is the most sought-after tool available in the marketplace today.
It is a well-known brand whose clients are big businesses such as American Pacific Mortgage and automobile companies like Tesla Inc.
The distinctive characteristic feature of this data visualization software is that it ensures the security of your data.
It also provides a selection of a wide range of visual tools to choose from as per your convenience.
Pros
Cons
Pricing:
The software comes with a basic plan which costs around $25 per month and an advanced plan which costs $495 per month with a free trial period of a fortnight.
Its brand value again attests to the efficacy of its services. The fact that so many businesses use it adds to the trust factor combined with the assurance of data protection and security which is very important today.
5. Datawrapper
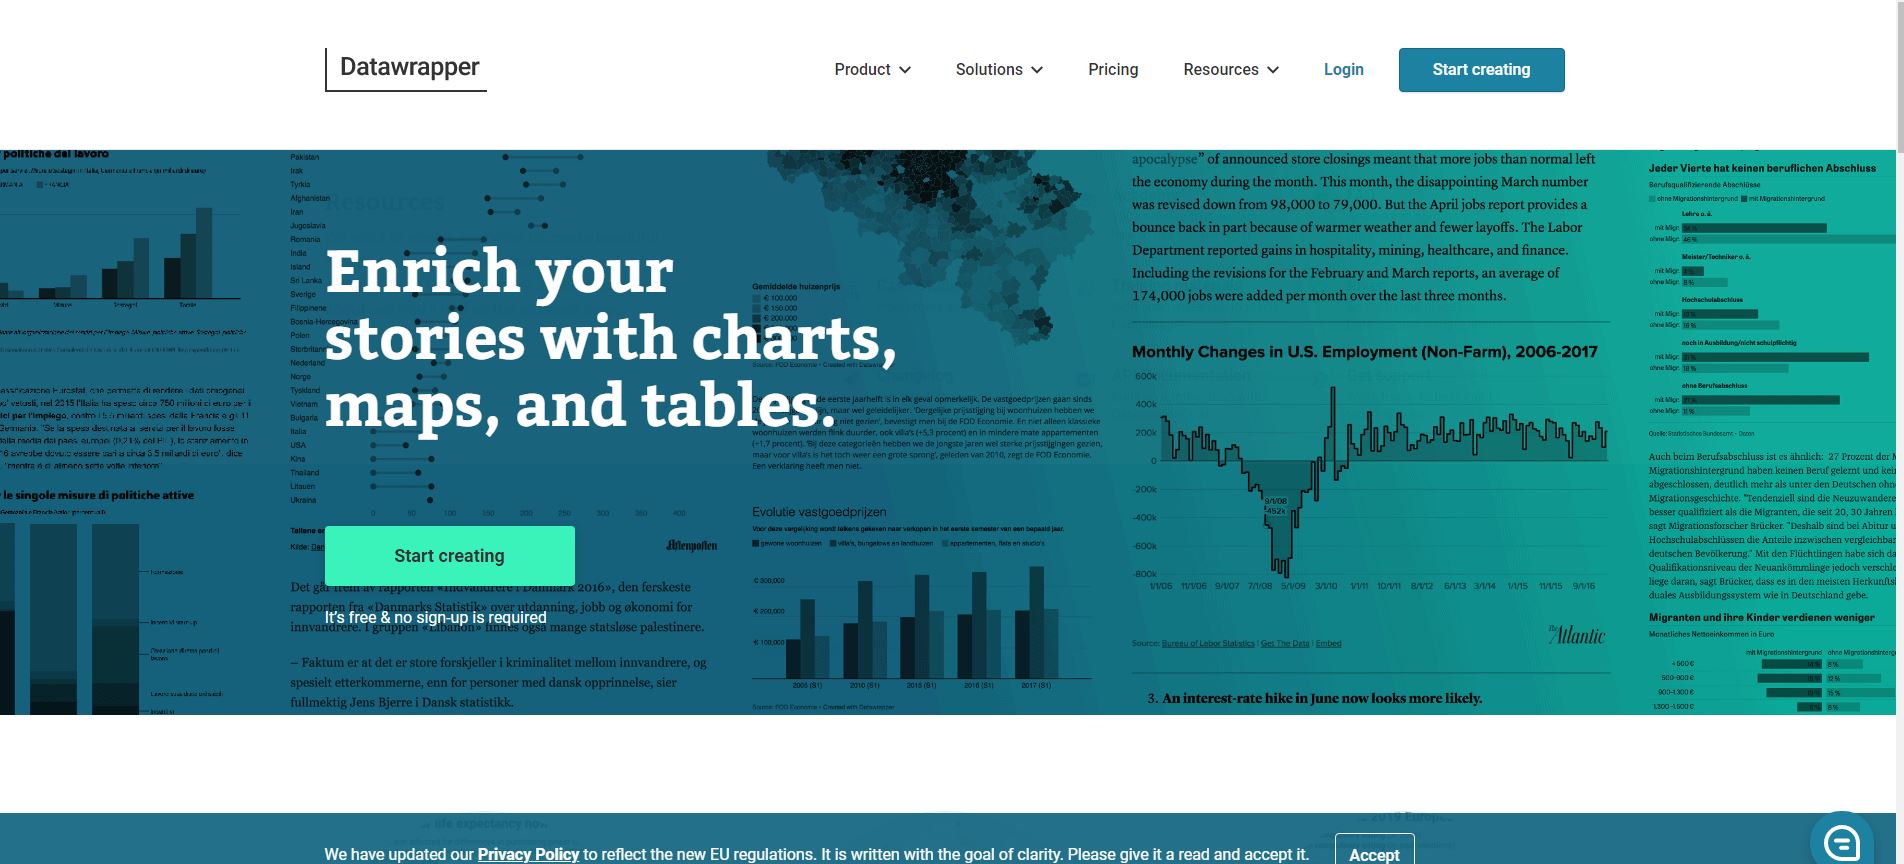
Datawrapper is one of the best data visualization software in the market and is highly preferred by students all around the world.
It is a mobile platform which creates simple charts on the basis of the data inserted.
It can be used across devices and to familiarize yourself with the world of data analysis. It is a stepping stone towards complexity and a perfect beginning point.
If you are a student looking to gain a footing in data analysis then this software is the gateway.
It is also an open-source software which means that you can avail the best services for free.
Pros
Cons
Pricing:
This software is largely free. The paid version however, is expensive and begins from 499 Euros. It is a one stop shop for common forms of visual representations such as bar charts, column charts, pie charts and their variations.
It is perfect if you are a beginner in the field of data analysis because the free version will provide you with a comprehensive learning experience.
6. ChartBlocks
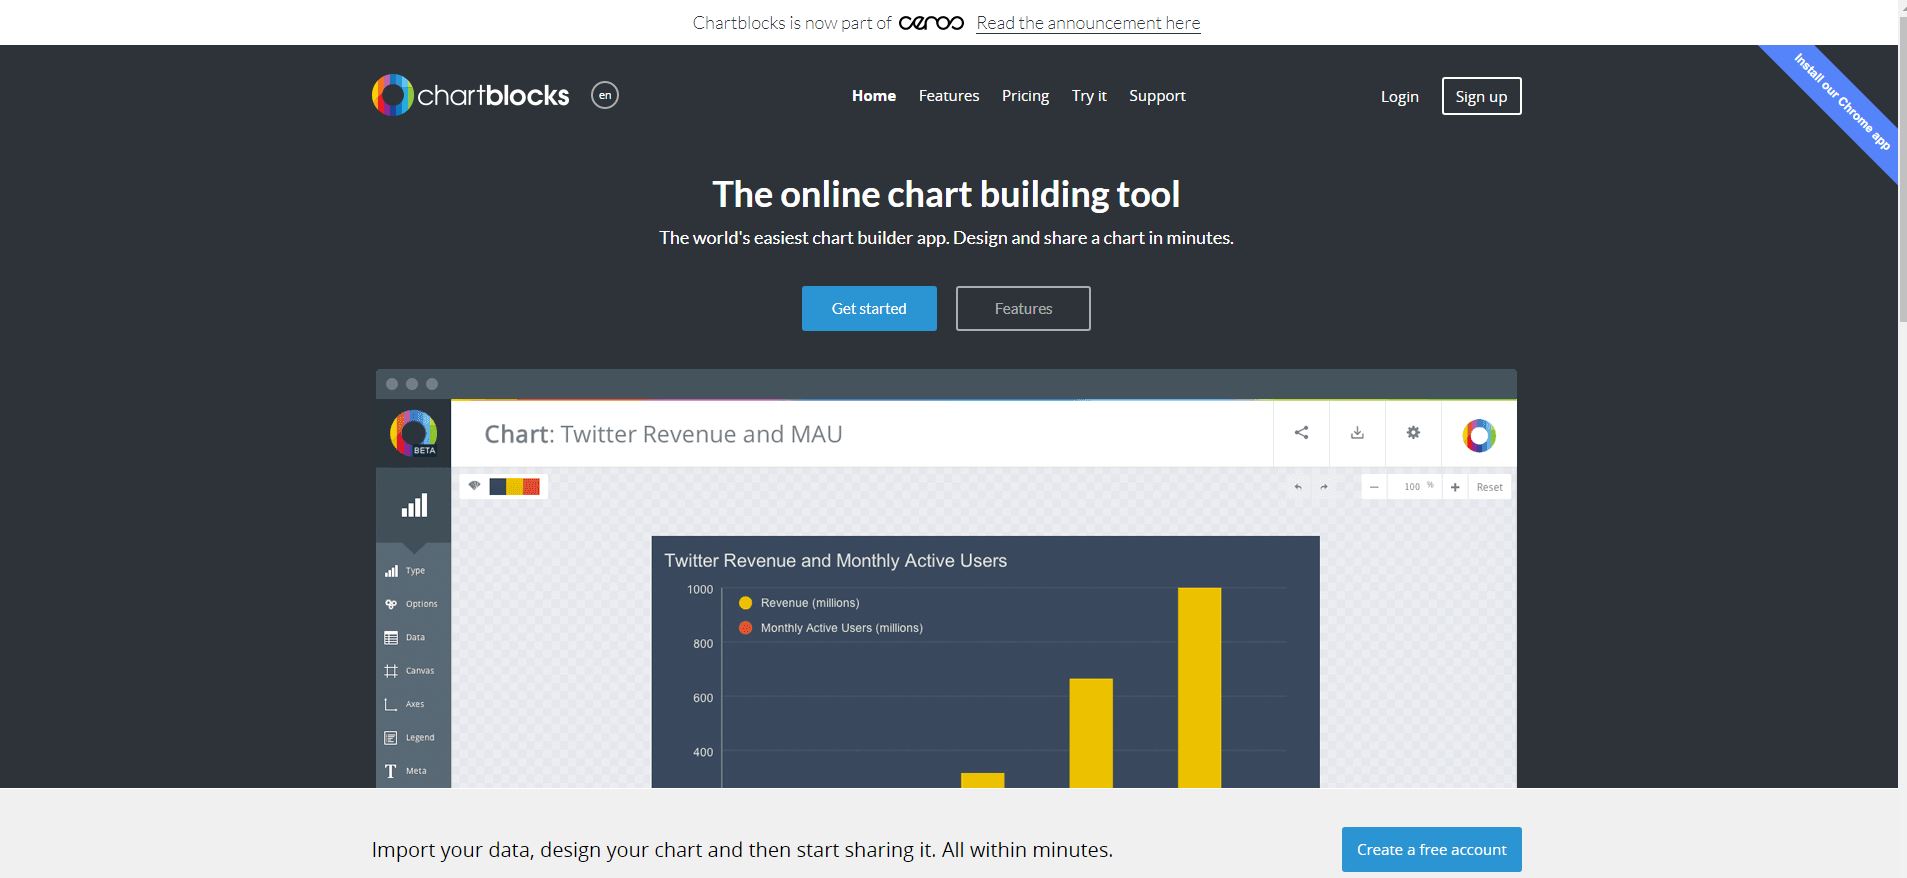
ChartBlocks is known for its speed of processing information.
The efficiency that this software provides is phenomenal. In today’s fast paced world which works on the principle ‘time is money’, this data visualization is a boon.
It provides innovation along with efficiency. It is mostly used by travel, insurance and medical industries.
The chart builder option, which is another distinctive feature, allows you to create your own modes of representation, thereby allowing you to exercise your creativity.
Pros
Cons
Pricing:
The price points are quite low- beginning from $20 a month. The free version provides more than 40 types of charts, which is adequate to glean the workings of the software before an investment.
The free version is also indefinite regardless of the fact that it provides a lower quality of export service which is understandable given the fact that it's free.
Perfect for small scale startups, the tool specializes in charts and provides immense value for money given how efficient it is.
7. D3.js
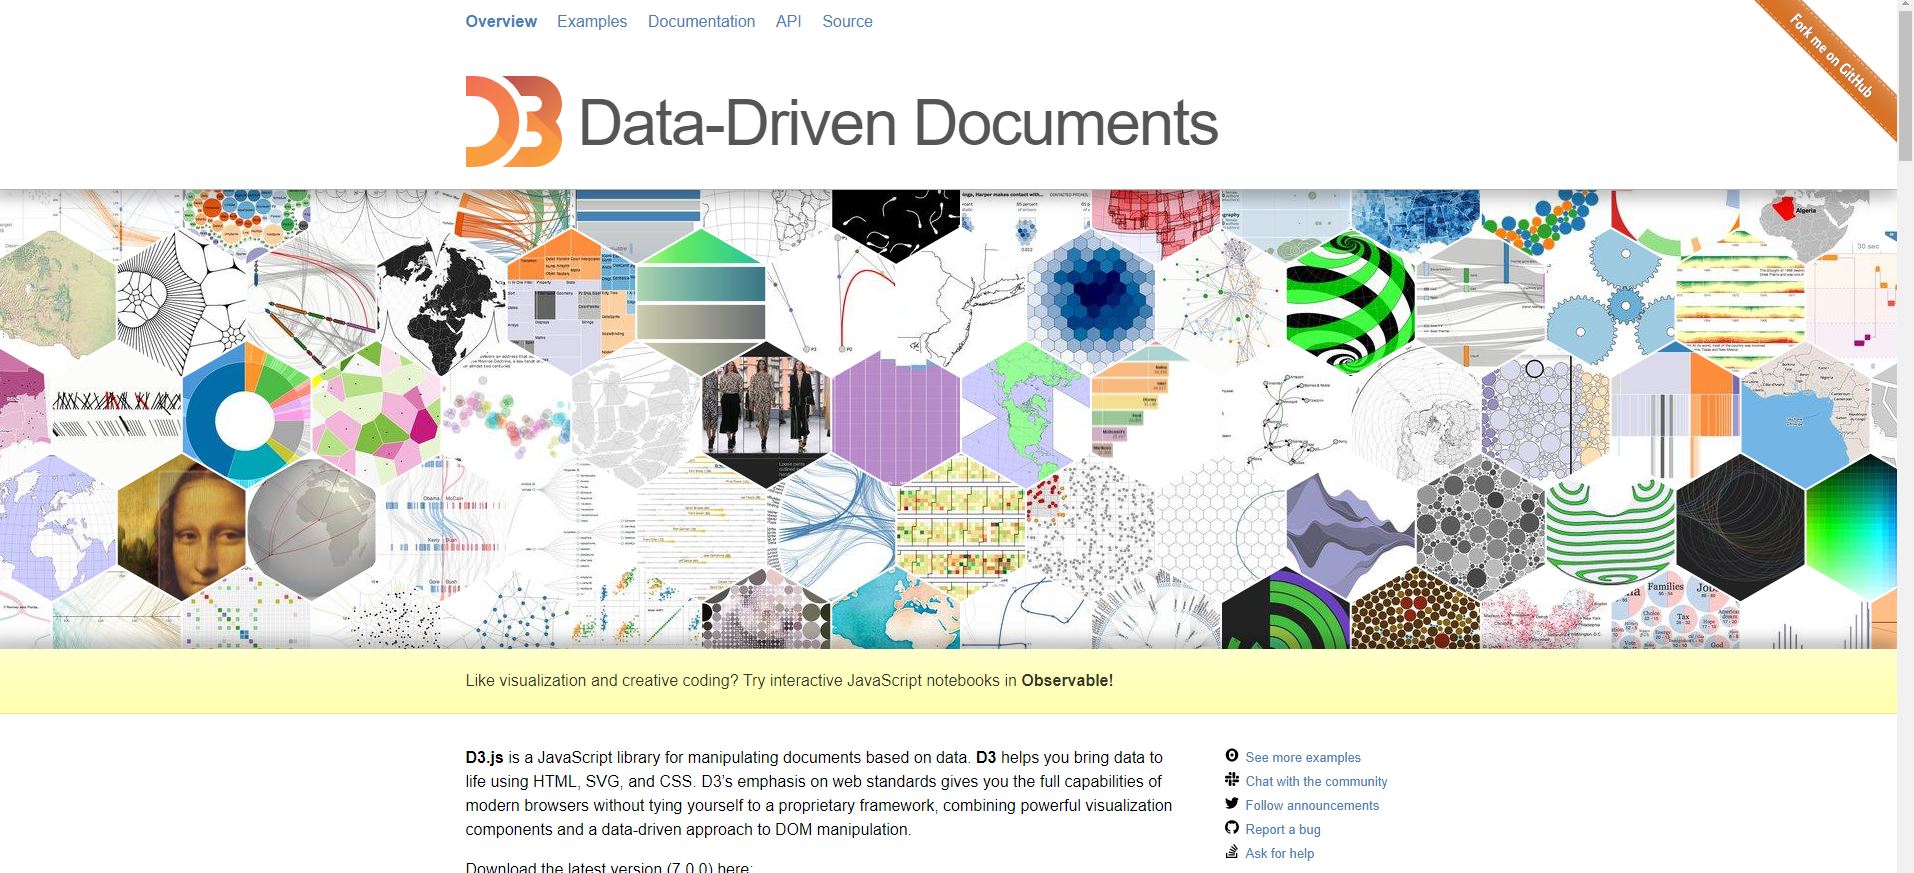
Another great data visualization tool is D3.js. It is a JavaScript based tool that is flexible in nature and supports declarative programming.
It is possible to manipulate data with this and you can also work on large datasets.
It also provides features such as various curve generating functions, code reusability, HTML, and more.
It has been observed that it works best for firms that require webpages or have to create websites. It can be used to create applications as well.
However, there might be some limitations in terms of design. The templates themselves are good to use for regular purposes.

Pros
Cons
Pricing:
D3.js is a really good option for people who require to build a website, applications, or websites. Here, the pricing system is quote-based.
So, you will have to get in touch with a vendor and then quote your price. Overall, it does provide you with all the features that you might require.
8. Visually
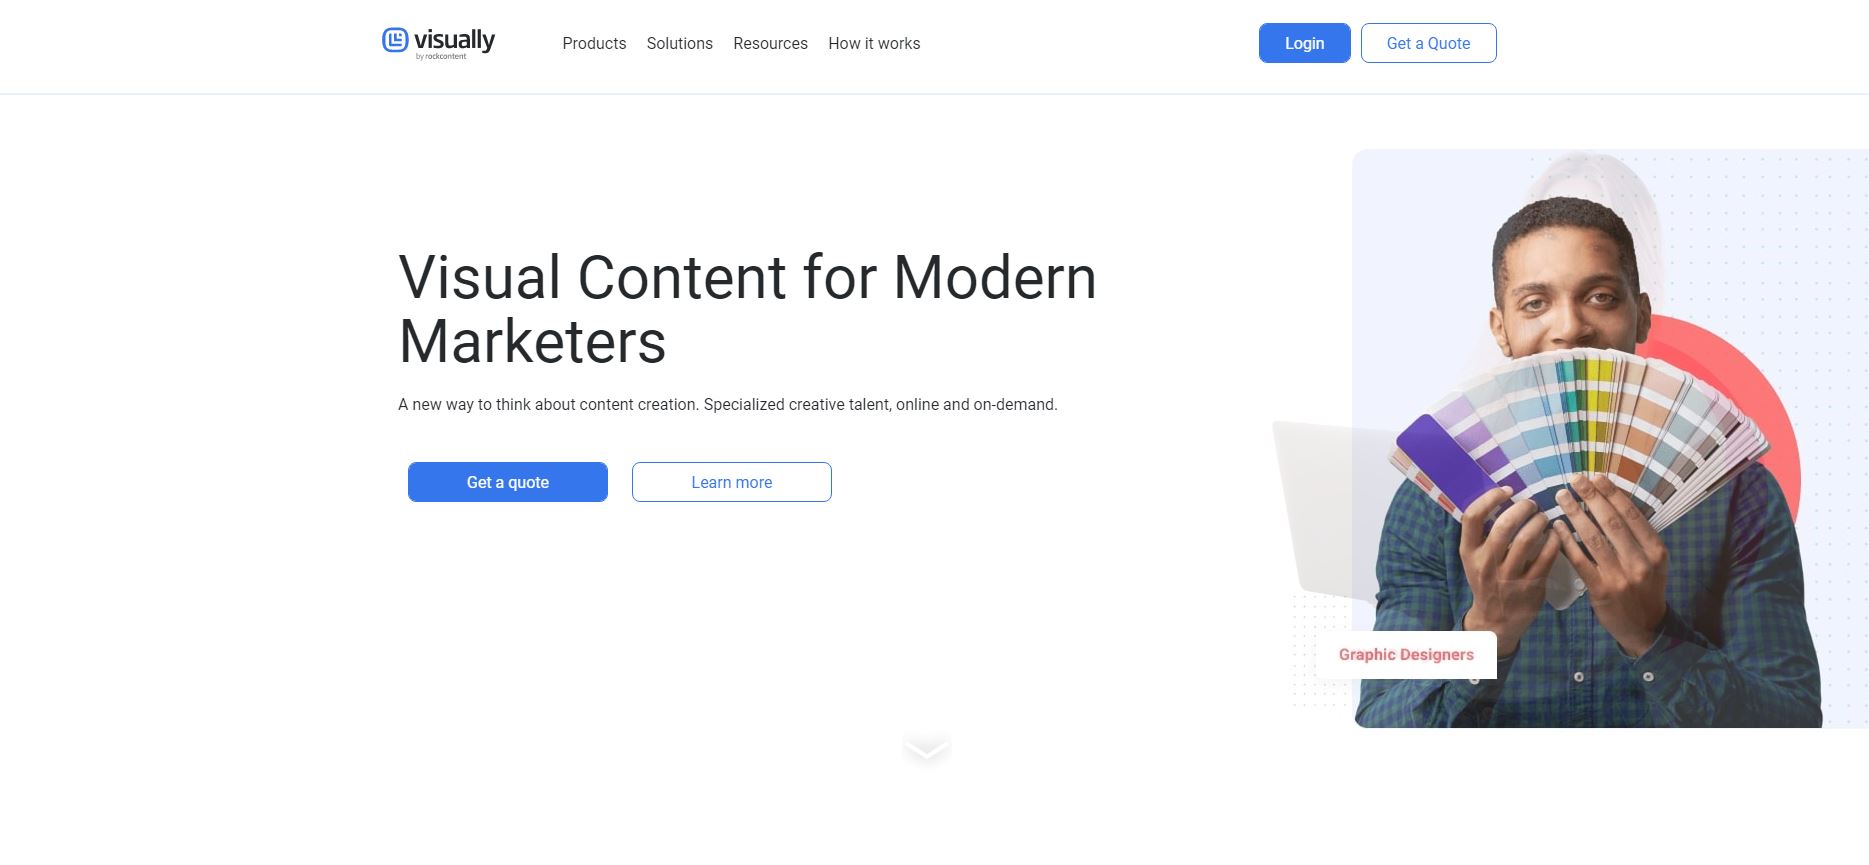
Visually is yet another data visualization software which is known for its high-quality export and ease of sharing to other platforms.
Visually is also a collaborative platform which encourages community projects and interdisciplinarity.
Its highly developed link with social media platforms facilitates innovation and an easy exchange of ideas and information.
Its clients are high profile marketing and IT based firms.

Pros
Cons
Pricing:
Since the price is not indicated on the official website, this information remains unclear. However, an estimate reveals that the price depends on the number of users.
It is an open-source tool for a fixed period after which the platform will approach you with a notification apprising you of the price points.
9. Plotly
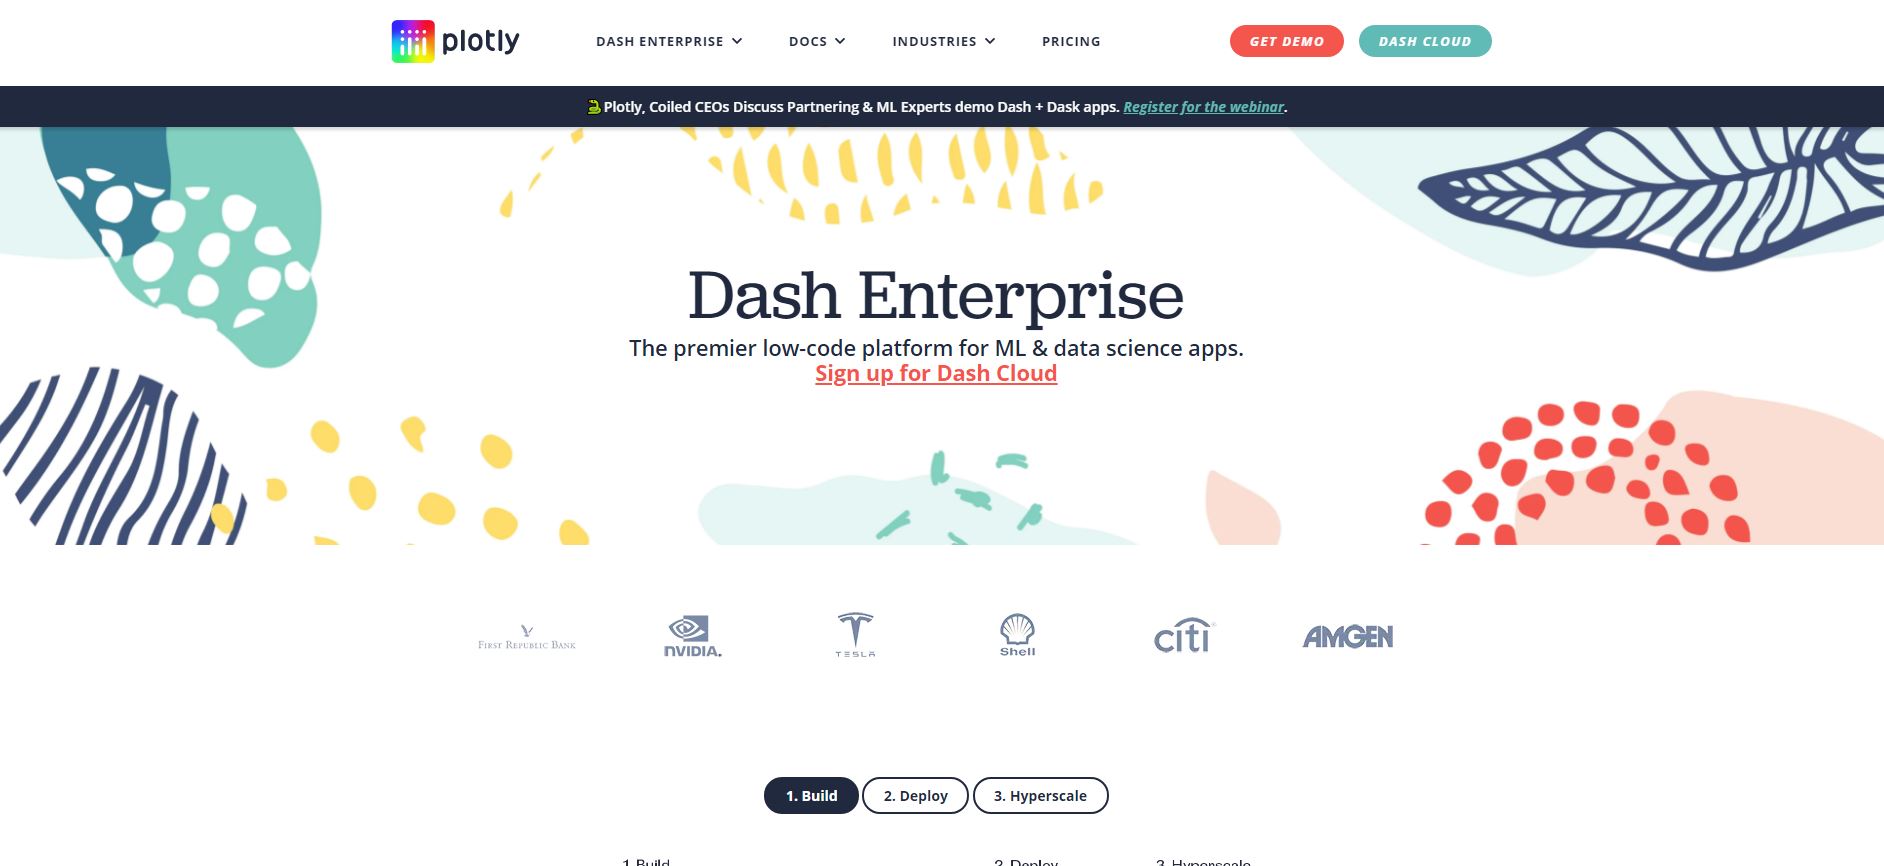
Plotly is known for its distinctive capability of managing as well as analyzing data.
Its comprehensive analytical reports help with organization and is perfect for studying trends.
It deploys artificial intelligence-based algorithms to solve complex problems.
It is perfect for large scale organizations and institutions due to its advanced technical abilities that it provides.
It is a platform which is specifically designed to process complicated and large-scale output and is best for large scale professional research.
Pros
Cons
Pricing:
The free plans are indefinite and the paid plans begin from $59 per user per year which is immensely cheap given the advanced abilities that it provides.
The value for money that you will get by investing in this data visualization tool is immense. If your focus is analysis and not mere presentation, then this is the perfect software for you.
10. Domo
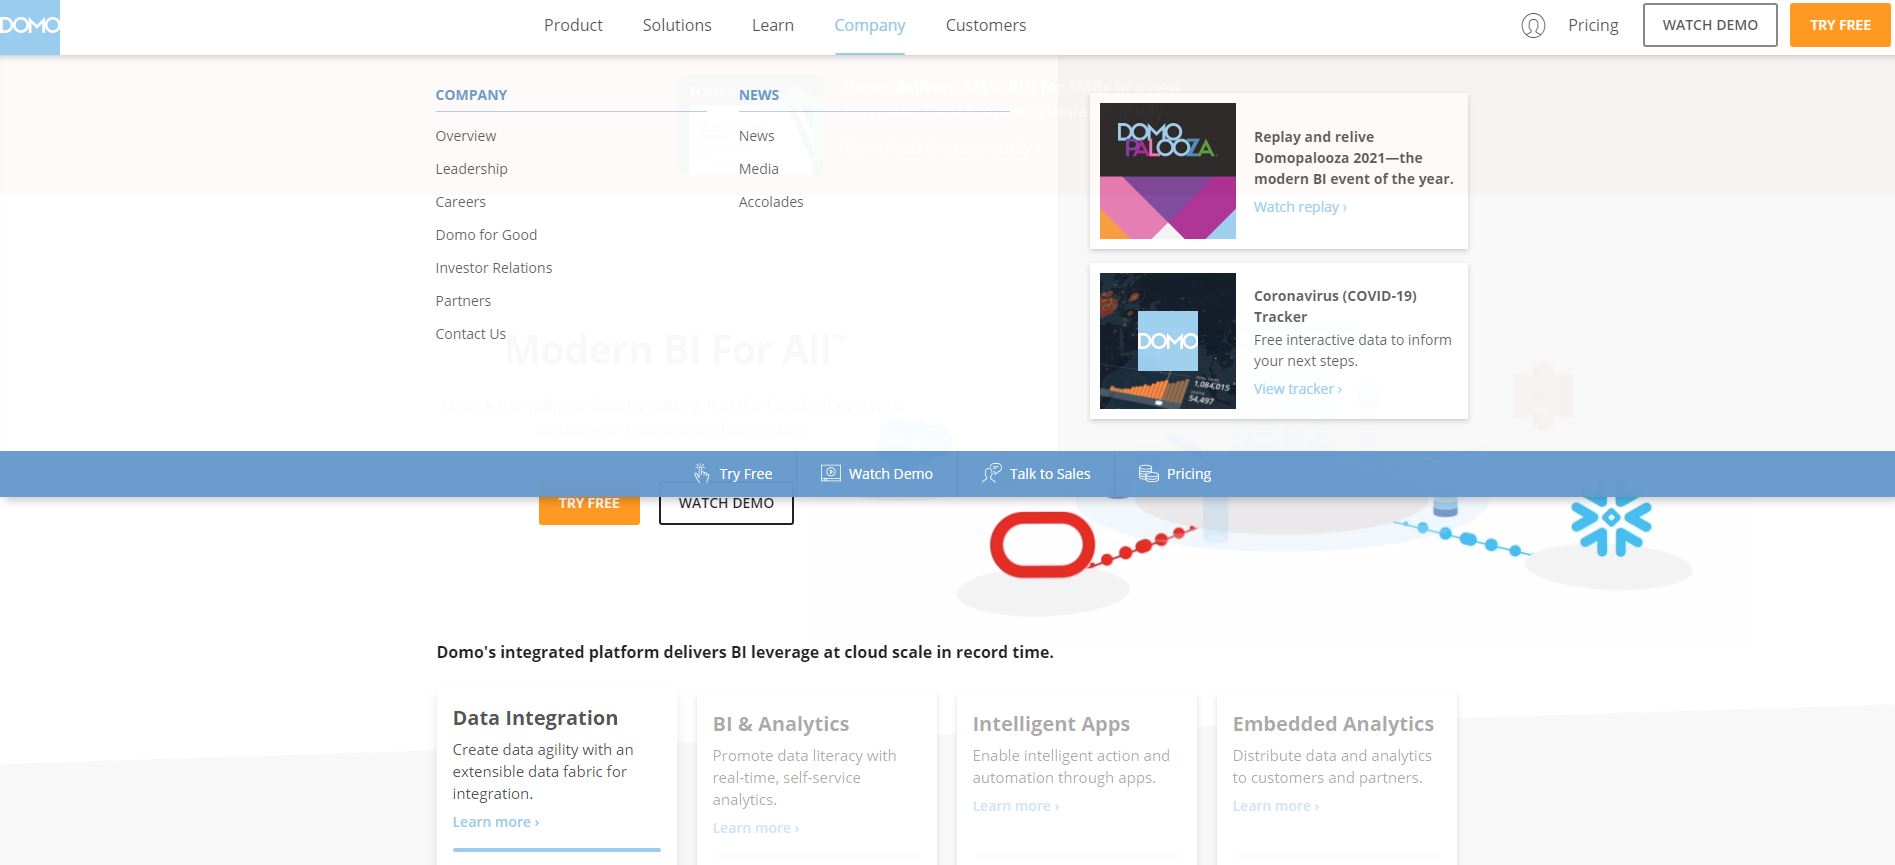
Domo is an advanced tool that suits the needs and requirements of businesses that have already possess an established Business Intelligence [BI] system.
Domo is a dynamic tool that contains data correctors which can effectively simplify the concept of social data visualization.
The tool also features various plug-ins that help people to manage data in a productive way.
Domo is known for its speed when it comes to the aspect of loading data. Therefore, it helps business organizations to save valuable time and effort in the long run.
All-in-all Domo is a great tool that will help your business to grow as it simplifies the process of data visualization considerably.

Pros
Cons
Pricing:
The pricing policies of Domo remain undisclosed as the company only reveals the information when a business is willing to sign-up for the free trial.
However, the basic plan of Domo is estimated to be priced at $83 which needs to be paid on a monthly basis.
11. Google Charts
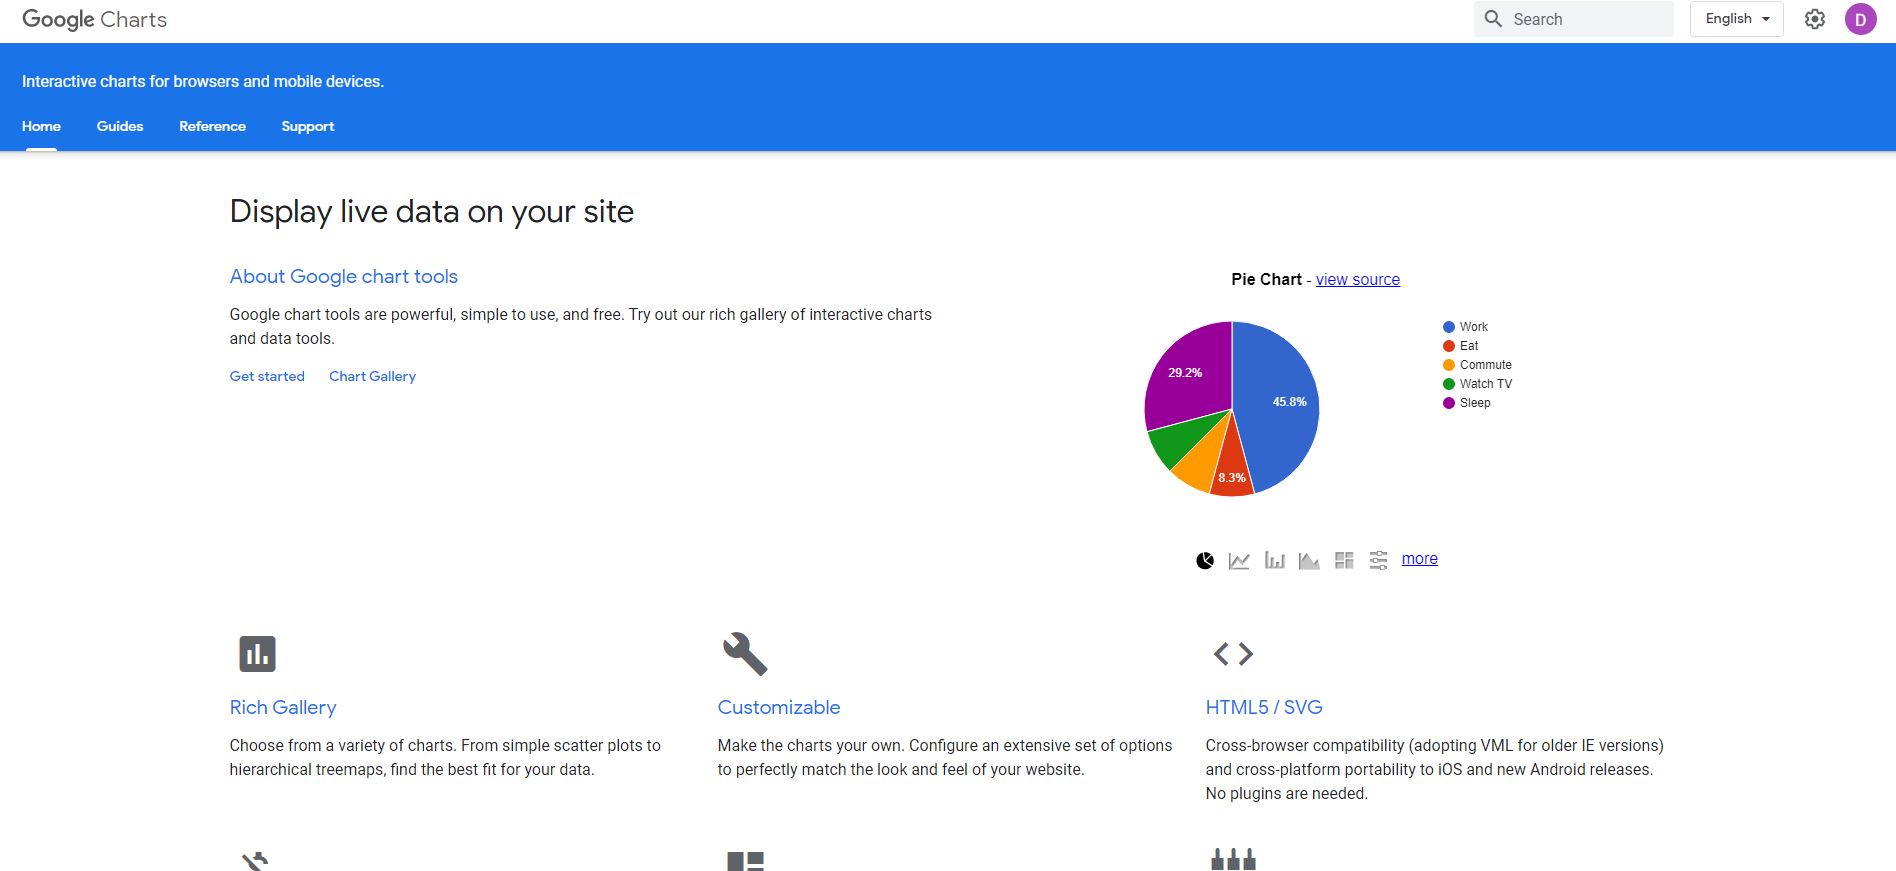
Google Charts is another popular data visualization tool. It is run by languages such as SVG and HTML5.
The charts that are available here are interactive in nature and it helps you get control over the charts that are created. There is some degree of customization available.
You can also zoom the charts and it is user-friendly. It does not require one to have technical knowledge.
The interface is easy to comprehend. It is intuitive in nature. It can enable you to create charts that are extremely professional simply.
There are interactive tools available such as animations and events that can help you to make a better design.

Pros
Cons
Pricing:
Google Charts is a really good option for people who are looking for a free tool that can provide the facility of good templates and an easy user interface.
It can integrate social media along with other Google tools which only adds to the convenience.
12. FusionCharts
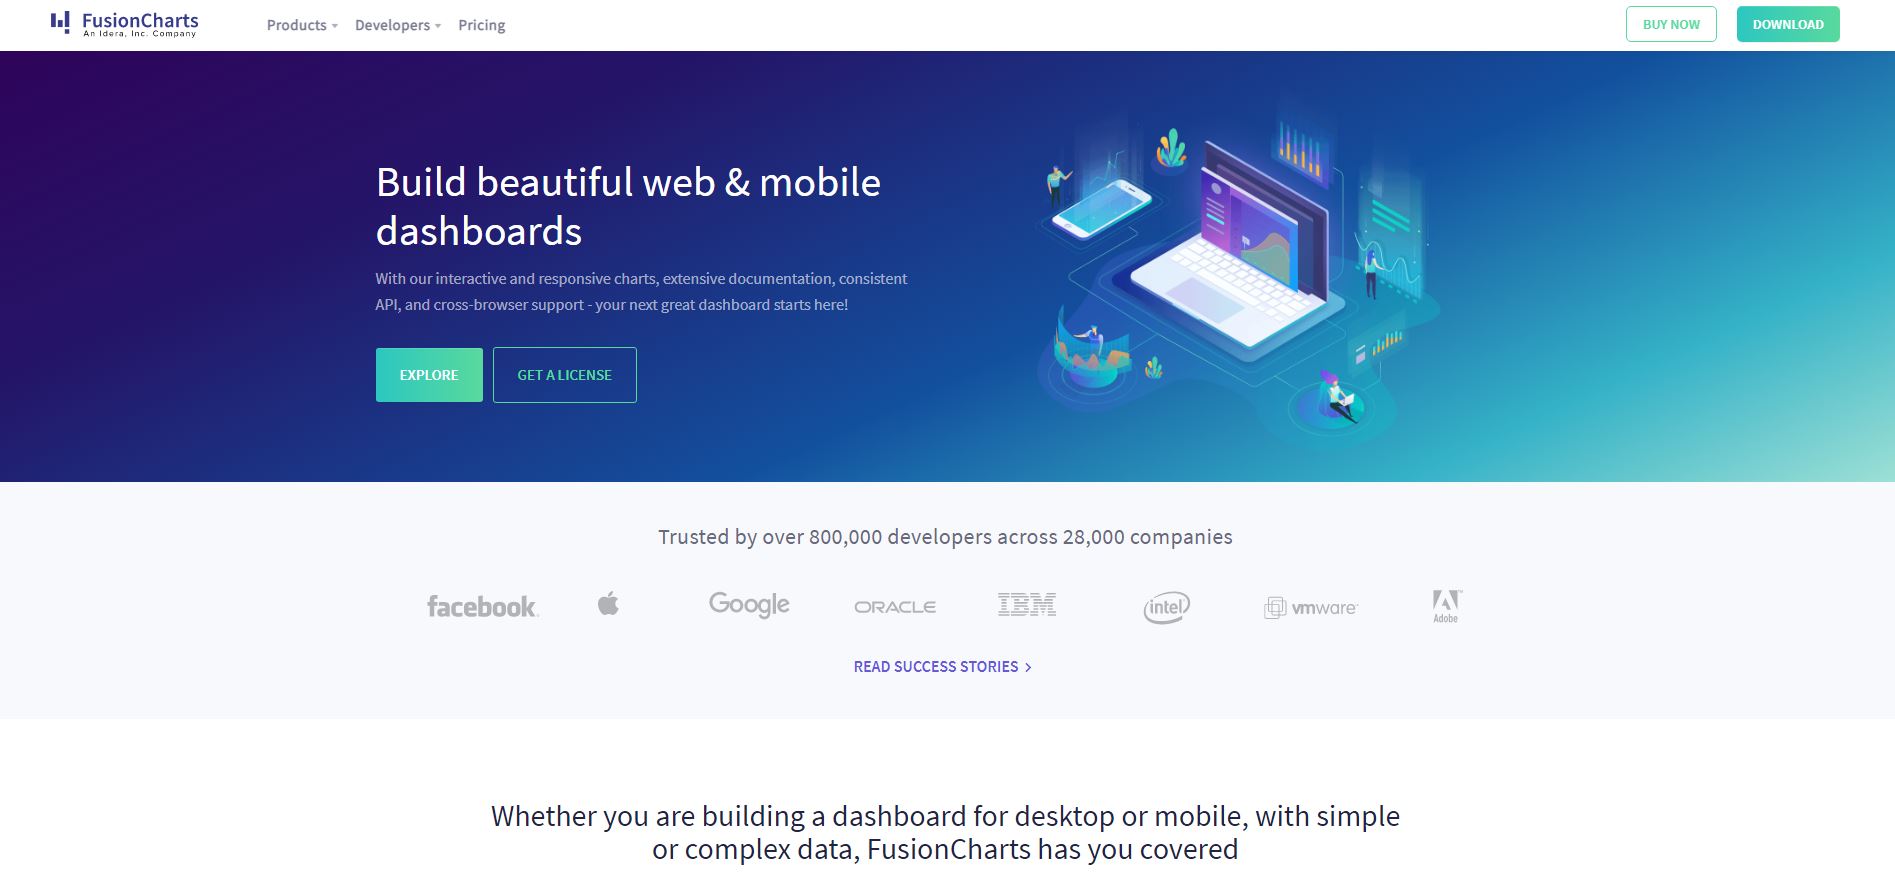
Another data visualization tool that is based on JavaScript is FusionCharts. It has an extensive charting library.
You can extract raw databases with the help of FusionCharts and then make meaningful reports out of them.
It provides 150+ in-built charts and has over 1000 maps that can help you process data.
This data visualization system is useful for both small and large businesses. There is customization available to a good degree.
You can also use themes provided by the system because they have business-specific charts as well that are unique to the industry you work in.
Pros
Cons
Pricing:
FusionCharts is a more high-level form of the data visualization tool. It is expensive in nature and provides a variety of features.
It is best suited for larger enterprises because they can afford it and use it to the best of the features it provides as well.
13. SAP Analytics
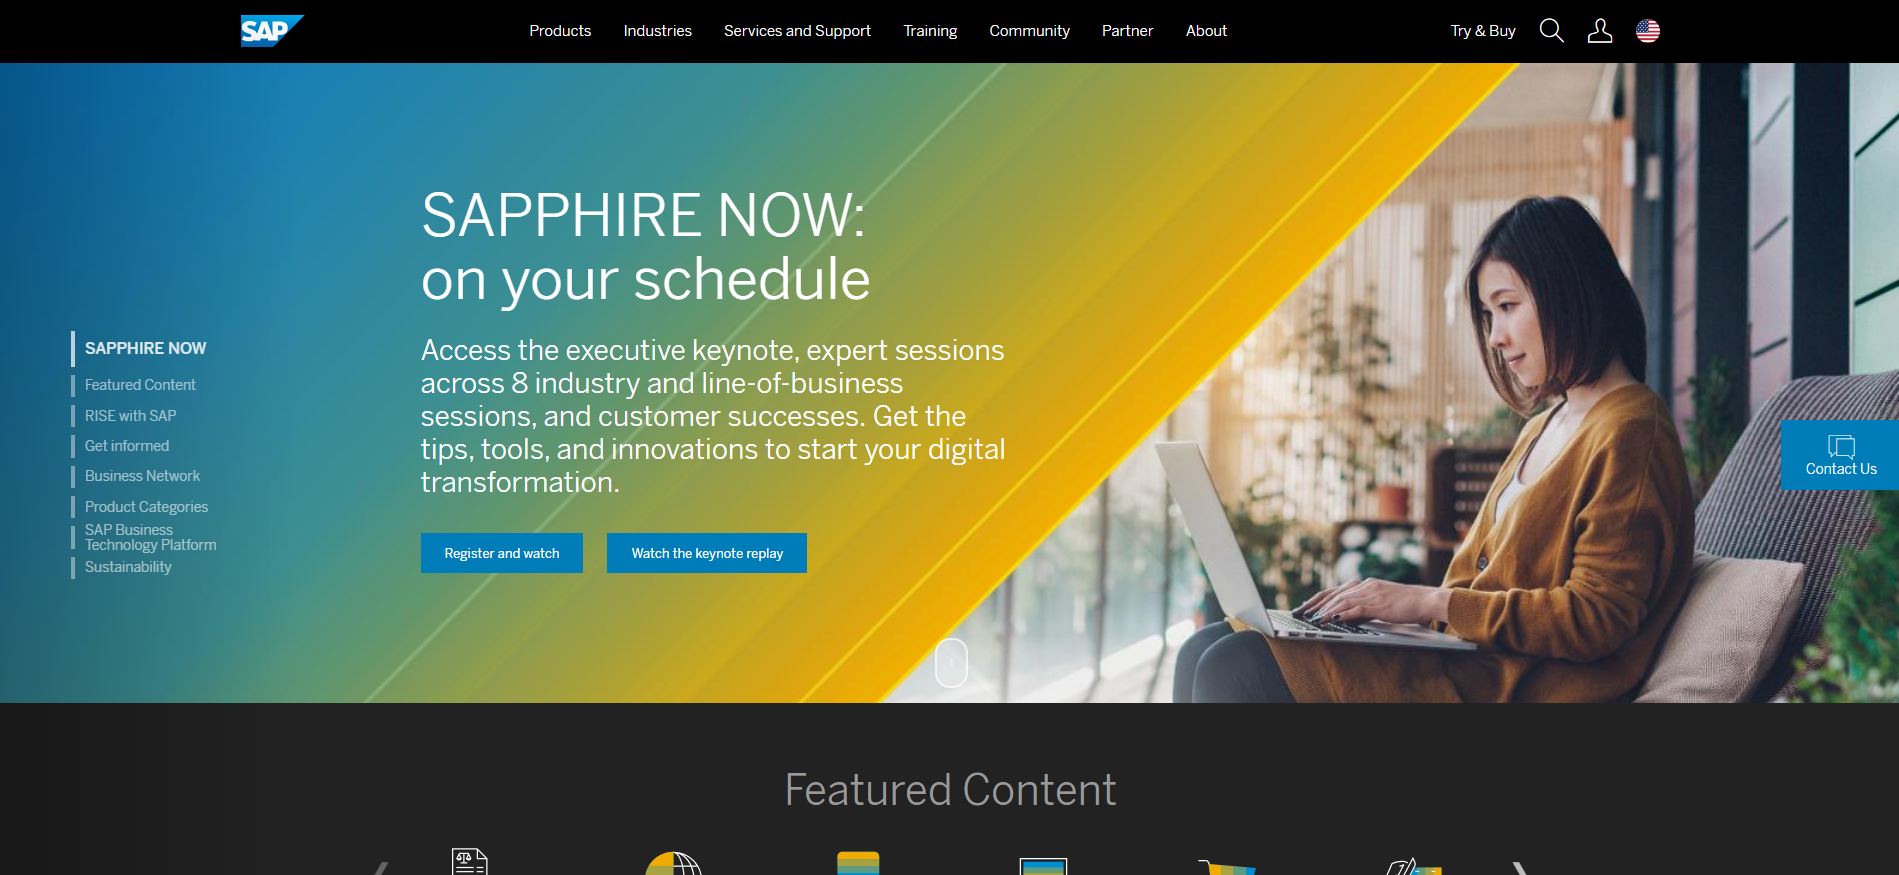
SAP Analytics can help you build reusable charts and it also has chart components.
The charts are neat and extreme customization is available as the features of augmented analytics and superior data visualization are present.
This is a really helpful feature when it comes to the utilization of charts.
The tool is coupled with machine learning features which helps business organizations to visually represent data adequately.
The availability of these features makes SAP analytics one of the best data visualization tools present in the market.

Pros
Cons
Pricing:
SAP Analytics offers a trial package which is completely free of cost for the first 90 days. The SAP Business Intelligence pack can be purchased at $36 per month.
On the other hand, a specific quotation request needs to be submitted to gain more information about the SAP Planning package.
14. Chart.js
There might be people who do not require extensive features and use these data visualization tools for smaller projects.
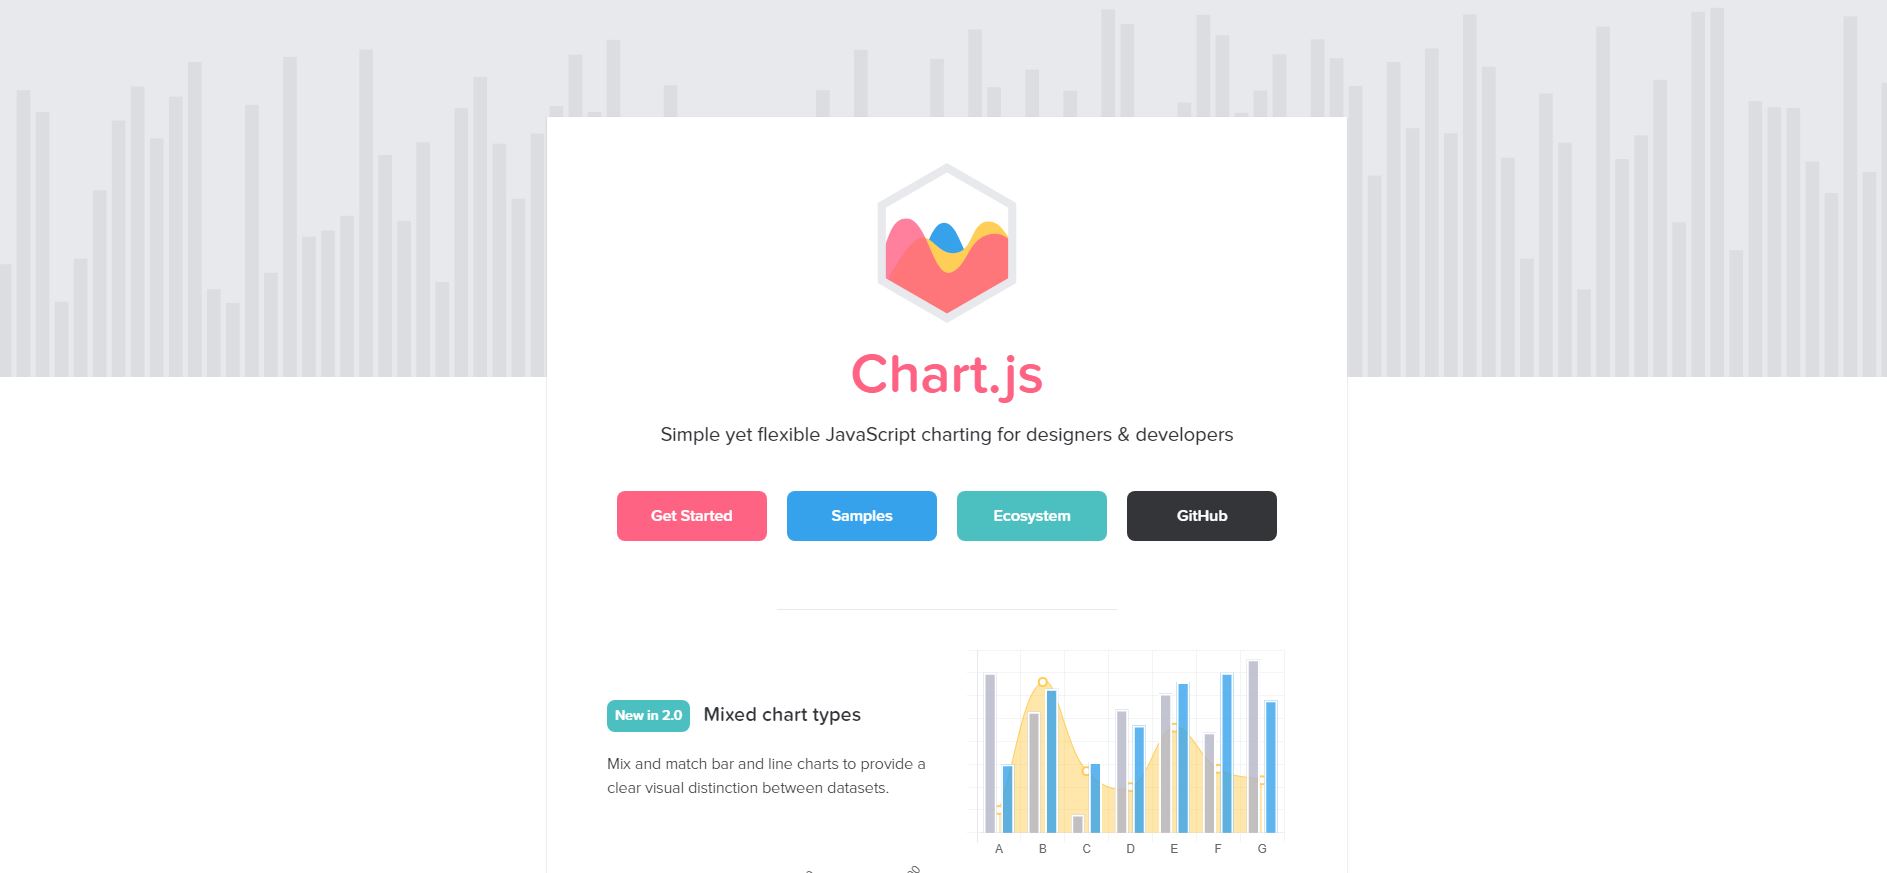
For them, Chart.js is perfect. It is a tool that is straightforward and flexible in the way it functions.
It supports charts such as bar, pie, line polar, doughnut, and radar.
It is maintained by an open community which is why it is entirely free of cost and provides prominent features such as the ability to visualize the data in 8 different ways and has an excellent scale granularity as well.
It uses Canvas HTML5.

Pros
Cons
Pricing:
Chart.js is a really good option for a data visualization tool when you want to work on smaller projects. It is a free form of tool and hence can be used by anyone, especially because it also has a user-friendly interface.
Looking for a business analytics service that will give you better insights about your business from the data which you already have?
If yes, the Microsoft Power BI is a business analytics service offered by Microsoft.
With this service you can transform the data from cloud or other sources like in an excel sheet and Microsoft Power BI will transform these undefined data into a proper module by creating graphs, and charts to give a better visual.
The primary function of this service is that it cleans and transforms data and presents it to you in a better visual format.
The data which matters to you the most is collected by Microsoft Power BI and this helps to track the important metrics.

Pros
Cons
Pricing:
It is a great initiative and service offered by Microsoft but one needs to have in-depth knowledge of Microsoft Power BI in order to run it smoothly.
The best part of it is that the price is very affordable. Microsoft Power BI has a free version and also a paid version. The paid version price starts at $9.99 per feature, per month.
Services Provided By Data Visualization Tools
Data visualization tools are usually software that convert raw data into a wide range of attractive visualizations either automatically or manually.
They provide pre- existing templates as well as the option to customize visual representation.
Types of visual representations provided by data visualization tools
- Pie Charts
- Bar Graphs
- Geographical maps
- Spatio- Temporal maps
- Heat Maps
- Spider Charts
- Sparklines
And a lot more.
Things To Consider Before Working With A Data Visualization Tool
Data visualization tools are required by every company, whether it is a large corporation or a smaller one.
It can enable the data to be presented in a more convenient way and helps you comprehend the data well as well.
However, there are several things you must take into consideration before working with a data visualization tool.
1. Data sources: Companies require the data to be presented in different ways. The data to be presented in reports might require a variety of ways in which it is showcased.
Different data visualization tools offer different features. Hence, you need to see if you want graphs or other features. Different tools provide different dashboard elements.
2. Transformation requirements: Data visualization tools allow the transformation of data. The transformation of data can be on the lines of joining or custom calculations.
Some tools provide more flexibility than others in this aspect. For example, Not all data visualization tools provide the facility of merging columns which might become frustrating to the user.
3. Access and size: Another aspect to take into consideration is by accessing this data. You might require your data visualization to connect to other tools such as Google Analytics.
It then becomes necessary to ensure that you can do it. Each of the tools that you might have seen above differs from which other tools it can connect to. They have pre-built connectors.
The size of the data you have also affected the speed and performance of the data visualization tool that you use. There are limitations to how much you can upload to these tools, make sure to check them.
4. Automation and sharing: Another factor to consider is to see if you need automation. The data reports might be required to be updated regularly. This can help in making accurate decisions.
There are data tools that enable live viewing of data, hence select a tool that possesses this feature if you require one.
In an organization, there is not one person who will access the data. Various people will be required to do so.
These tools allow you to share your data with various people conveniently. There are some tools that provide direct access and there are some that charge you for additional viewing.
5. Customization: Each tool that is offered differs in the way in the degree of customization it provides. Some companies might not have their priority to customize the way data is provided to the T.
However, some people, companies, and individuals might require complete personalization.
6. Budget: After all of these points are taken into consideration, ensure that you can afford the data visualization tool.
There are free as well as paid tools that are available. Both of them offer different features.
These are the six most important aspects that you must keep in mind when you are planning to work with a data visualization tool.
The utility and requirement of each individual or business will differ. Ensure that you are aware of the features the tool has to offer before planning to work with it.
The Benefits Of Using Data Visualization Tools
Data visualization is a tool that is used by both small and large businesses. Today, there is an increased demand for Big Data which only makes it more imperative to use data visualization tools.
Large amounts of data are stored; however, this data is also supposed to be analyzed as well and it can become inconvenient. There are various benefits that are provided by data visualization tools.
1. Data processing: Data visualization tools enable us to present data in a way it is more comprehensive. It is visually showing us the data.
Our minds in general process visual cues more easily as compared to other forms of data presentation. In Fact, it has been observed that 93% of human communication is visual.
Thus, when data visualization tools present the information visually, it is possible to comprehend these big chunks of data more easily.
2. Faster and easier access: Data visualization in general increases the speed at which data is consumed. As mentioned above it can make it easy to comprehend Big Data.
This helps in quicker decision making as less time is spent on understanding the data. Apart from this, data visualization can also contribute to increasing the speed at which we can access information that is relevant to us.
Traditional reporting and dashboards can involve more hassle and result in increasing the time taken to make decisions.
3. Communication of findings productively: Another important benefit that is derived from data visualization tools is the ability to have more productive thinking.
When data is visually presented and is understood in a better way, it also makes it possible for the teams to communicate better when there is a deeper understanding of the data.
This makes it possible for them to come up with creative solutions and think in a more productive manner.
4. Insights: A major benefit that is provided by data visualization tools is the capacity to analyze insights differently than one would in traditional reporting.
Not only can the team members get relevant information but they can also identify areas of performance. All areas can be analyzed and comprehensive solutions can be formed with the help of these tools.
5. Sales: Data visualization tools can enable you to look at data on a real-time basis. This can help you not only understand the effect of past actions but also enable you to predict sales in the future.
This will help decision-makers to come up with policies that can increase these sales figures in the favor of the business.
You can make improved marketing strategies and alter your inventory based on the response of your target consumer. Ultimately all of this will lead to an increase in sales and thus, consequently the revenue.
Important Things To Keep In Mind Before Investing
Set your goals and clearly identify the purpose first. This will provide you with a checklist of possible features to consider while investing in a software.
A number of features such as reporting, business intelligence, statistics and analysis are available, what features work the best for you is what will determine the choice of the tool.
You also need to look at the data source in order to find the perfect software for its processing. This requires a study of the important methods and the way it works with a particular tool.
Similarly, the information which is generated after processing of the data needs to be exported somewhere. Considering a tool which allows easy sharing and export then, becomes important.
Flexibility of the software and its ability to suit your needs are the prime factors to consider before committing to a purchase.
1. Avail a free trial: a trial run ensures that you know what you are getting into. It provides you an opportunity to test the software and its capabilities for free.
2. Carefully examine all the features: consider the types of graphical representation that a tool provides; if these representations fit your standards, then go for it.
3. Find out the pre-requisites: important pre-requisites like specific data format needs to be kept in mind before buying a software.
For instance, if the software supports only SQL databases, then it wouldn't work on other kinds of databases.
4. Check the capacity: check to see if the tool can generate visuals in real time, as the data is entered. This is important in case of trend mapping.
5. Storage and export: Storage and export capabilities of the visualization software are imperative because they allow results to be displayed for sharing and consumption.
One should check to see if the software exports the visuals in all the commonly used formats such as .jpg, .jpeg, pdf etc.
6. Ease of usage: the easier to use a software is, the more efficient your task will be.
Data visualization is a branch of data analysis which deals with the presentational aspect of data. Data presented in a specific format can yield specific insights.
With each shift in perspective, we get new ways of analyzing the data. We can either look at it in detail or from a bird’s eye view- each approach will result in different results.
The primary goal of a visual representation is communication of information. The nature of this communication should ideally be clear, transparent, and innovative. It should be done in a manner that reveals insights.
Data visualization should:
- Display the data
- Faithfully represent it without any distortion
- Be concise
- Be coherent
- Eye- catching
- Fulfill a particular purpose
- Collaborate with the statistics of a particular database
The sheer amount and the discrete nature of data makes it almost impossible to glean intelligence from it. Data visualization quickly makes these hidden insights apparent. It is an indispensable method of communicating information and demonstrating trends.
One can use it to conduct a thorough research of changes in trends, historical mapping, impact of changes in policies, investigate the relationships between various variables and a lot more.
This information is ultimately deployed to make important decisions and conclusions which have a significant impact on your business.
Analysis is based on important categories like distinctive features, ease of usage, efficiency, versatility, flexibility, a detailed comparison of price points, and possible merits and demerits so that you can make an informed decision and go only with the option that works best for the particularities of your organization.
Conclusion
These are the benefits that one can get if they make use of data visualization tools. Today it is not limited to large companies to use it. Smaller businesses also make use of it to increase their overall business.
These are the 16 best data visualizations that one needs to try if they are looking for data visualization tools.
In today’s era where there is increasingly more data that everyone is consuming, it is important to keep in mind that it is not possible for companies to merely rely on traditional styles of reporting.
Earlier it was assumed that it is only larger corporations that require these tools because of the amount of data that they require to analyze.
However, that is not the case anymore. Smaller or medium businesses have also realized the importance of these data visualization tools.
They help in handling any kind and size of data effectively and constitute efficient decision-making that can in turn increase your business.
As mentioned above it can help you to make decisions quicker and features such as live viewing can help you come up with policies that increase your sales. The data visualization tools that are provided here are free as well as paid options.
You can look into the guide that talks about the things you must take into consideration before working with a tool, this will help you choose the tools that work for you.
